EA: Coronavirus impact on CO2 emissions six times larger than 2008 financial crisis
The world’s CO2 emissions are expected to fall by 8% this year as the coronavirus pandemic shuts down much of the global economy, according to the International Energy Agency (IEA).
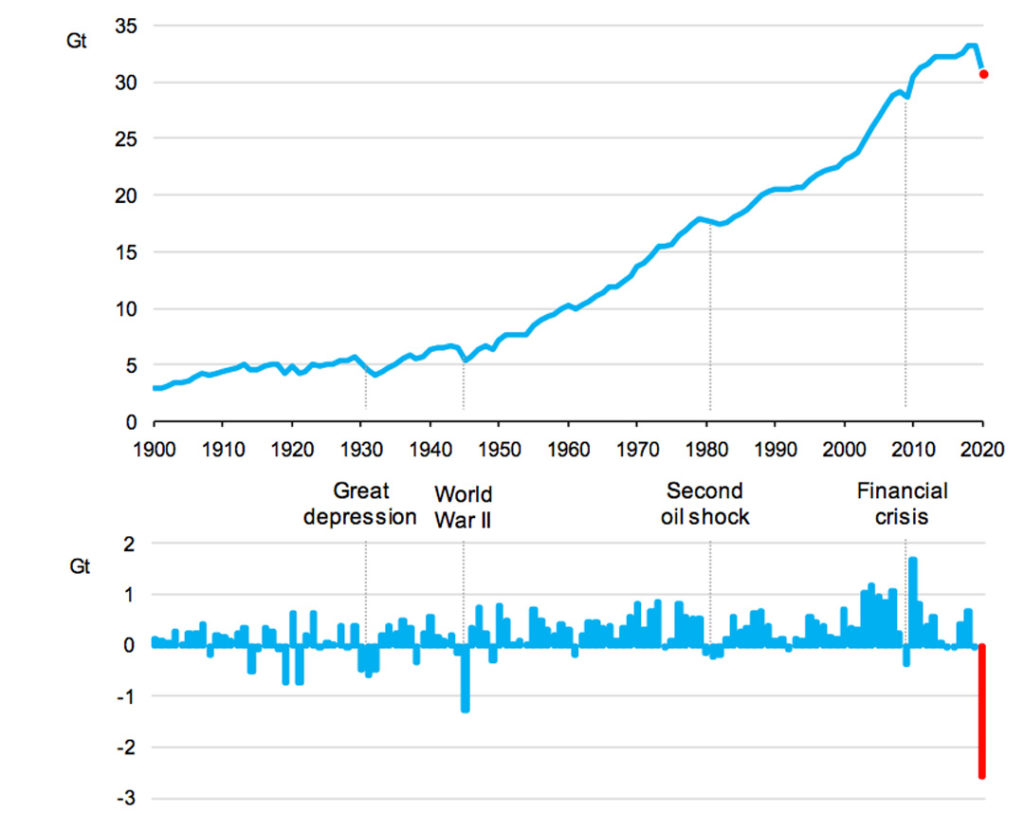
Such a drop would be the largest ever recorded in terms of tonnes of CO2, some six times greater than the impact of the 2008 financial crisis.
The agency’s new Global Energy Review is based on extensive data from the year so far and is intended to provide close to a real-time estimate of energy usage and emissions.
Its projections for the whole of 2020 are based on a series of assumptions including that the lockdowns, curfews and closure of schools and businesses currently in place are gradually eased over the coming months.
However, as the pandemic spreads and its devastating impacts continue to unfold, the agency makes clear that there are still “major uncertainties” about how it will play out.
The IEA’s central figure of 8% is even higher than previous estimates, including analysis conducted by Carbon Brief and published earlier this month, which was based on a less comprehensive dataset and less recent data.
An 8% cut is roughly equivalent to the annual emissions reductions needed to limit warming to less than 1.5C above pre-industrial temperatures. However, the stretch target laid out in the Paris Agreement would require similar reductions every year this decade.
The agency is clear that the expected decline in emissions due to a pandemic is “absolutely nothing to cheer”. Moreover, it emphasises the importance of prioritising clean energy in economic recovery plans in order to avoid a sharp rebound in emissions.
Unprecedented shock
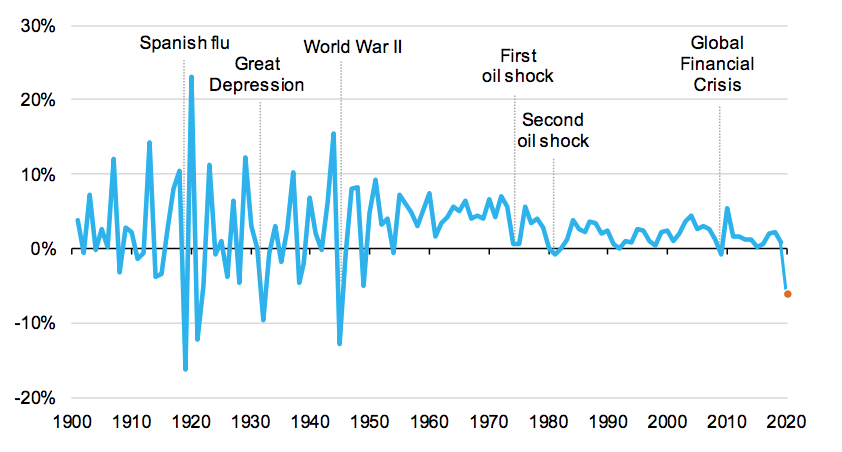
Describing the pandemic as a “a macroeconomic shock that is unprecedented in peacetime”, the IEA draws comparisons with the impact that wars and other recent crises have had on the global energy system. Some of these events can be seen in the figure below.
The report compares the covid-19 pandemic with the last financial crisis, when growth in China and India “was able to largely offset reductions elsewhere”. This time around, both nations are also feeling the effects of the disease and such an offset is unlikely.
As it spreads to virtually every nation on the planet, the impact of coronavirus is being felt in all walks of life, but different sectors are being affected in very different ways.
Energy use for residential gas heating or electricity use for server farms and digital equipment may even show a significant increase in the coming months, the IEA says, whereas other sectors such as aviation have collapsed.
Global energy demand was 3.8% lower in the first quarter of 2020 than last year, the IEA says, and it expects the annual total to drop by 6% year-on-year in 2020.
Such a decline has not been seen for decades, as the chart below shows, and will effectively wipe out five years of demand growth.
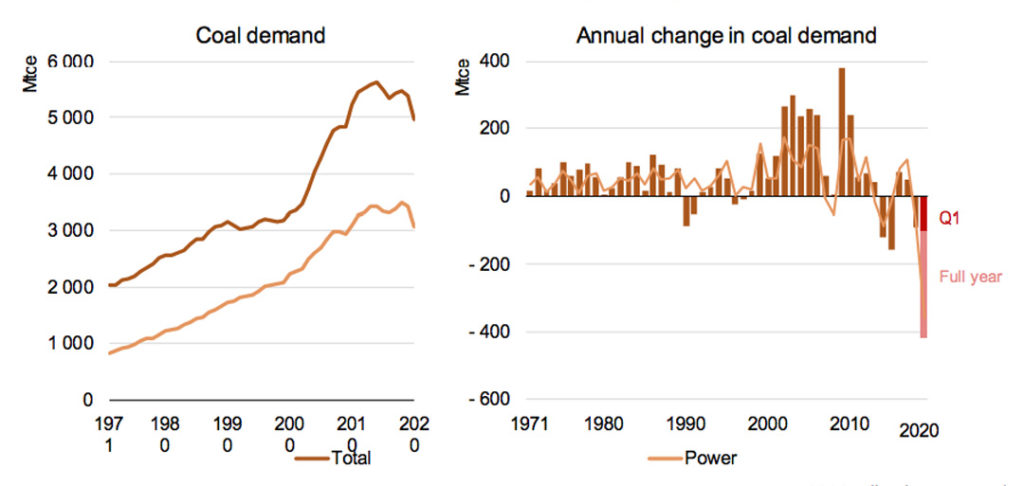
CO2 emissions are expected to fall to 30.6bn tonnes of CO2 (GtCO2) this year, an 8% drop from last year, with declining coal use the most significant factor.
The drop in coal combustion is being driven mainly by the power sector, the IEA says, together with competition from cheap natural gas and industrial slowdown. Coal demand is expected to fall 8%, but as China’s industrial sector starts up again, it is expected to go some way to offsetting larger declines.
Due to the global lockdown’s impact on transport, illustrated in the charts below, demand for oil has fallen at an “unprecedented scale” in the first four months of the year.
This is particularly true for fuels used in passenger transport, namely petrol and kerosene. Meanwhile demand for diesel, a substantial portion of which is used to power vehicles that transport goods, is expected to remain stronger. Overall, oil demand is expected to drop by 9% across the year after a 29% drop in the month of April.
As a side-effect of declining transport activity, car sales are expected to decline. In March, EU sales were 55% lower than 2019 levels, and if this trend plays out in nations with fuel economy standards in place, improvements in energy efficiency will be slower, the IEA notes.
Gas demand is expected to fall less than oil or coal as it is less vulnerable to changes in transportation demand, although the IEA says it could still fall by 5%. Gas will be particularly susceptible if countries in the Middle East and North Africa enter long lockdowns, the agency says, due to their reliance on the fuel for power.
In general, nuclear power is expected to fare better than fossil fuels, with lockdowns expected to reduce global output by 3% due to falling demand and disrupted construction. Already, delays have been announced to projects in China and Finland, and more are expected in the UK, US and France.
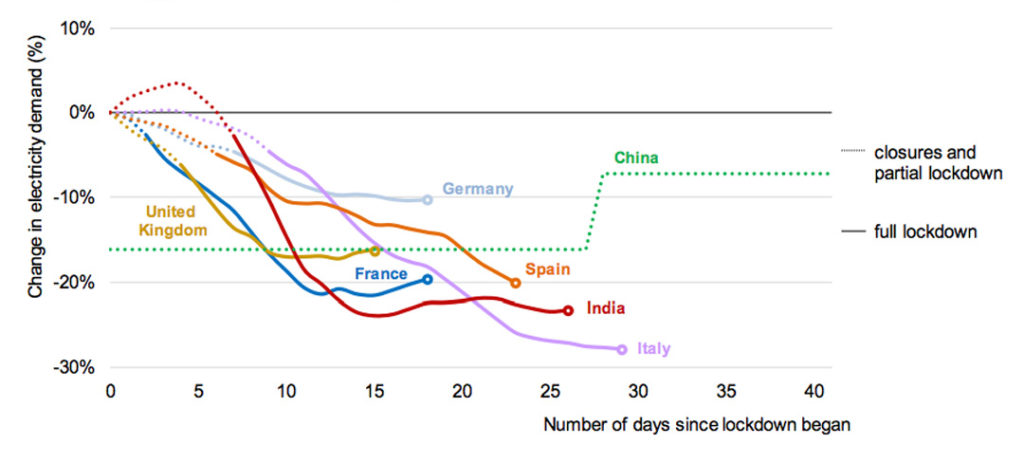
As the figure below shows, lockdowns in recent months have pushed down electricity demand significantly, with the strongest impacts found in nations with service-based economies and the strictest lockdowns, such as Italy.
It is worth noting that as pointed out in Carbon Brief’s recent analysis, it is difficult to assign effects specifically to coronavirus as many other factors will influence energy demand and emissions over the course of the year.
As an example, the IEA points to “milder than average” weather throughout most of the northern hemisphere in the first quarter of the year, which played a part in pushing down energy demand due to less gas being used for heating.
Renewables ascend
As fossil fuel use sank in the first few months of 2020, renewables remained stable, as in general they are given priority access to electricity grids and are not required to adjust their output based on demand.
Combined with rising capacity as new wind and solar facilities are built, this means that renewable electricity generation rose by almost 3% in the first quarter of the year.
As a result, renewables achieved record-high hourly shares in Belgium, Italy, Germany, Hungary and parts of the US. Analysis just published by Carbon Brief shows a similar trend, with wind and solar reaching a record-high share of generation across Europe over the past 30 days.
These records reflect a rising renewable share of the electricity mix of countries around the world – where demand has declined during lockdowns – as shown in the chart, below.